
In the grand scheme of things, I’m relatively new to golf. But the gauntlet is down and the personal challenge of ‘man’ vs ‘the elements’ vs ‘tiny white ball’ is on. With each round I’m learning, and as time goes by it’s becoming increasingly clear (and blazingly obvious) to me that my good scoring days always seem to coincide with my good putting days.
The importance of good putting was highlighted this weekend by none other than 2015’s Masters Champion, Jordan Spieth. Without taking too much away from his complete game, I think it’s fair to say that his record breaking win was mostly down to the putting masterclass he ran over the whole 4 days, on the glass like greens of Augusta National, he displayed discipline and skill on the grandest stage that surpassed all expectations and challengers.
So, in the starkest of contrasts, with Spieth’s putting display still fresh in the memory, here’s my thoughts and findings on my putting game.
My Top 5 Rounds
It comes as no surprise that my best ever score also coincides with my lowest ever putting average over 18 holes, but what is interesting is that it wasn’t by sticking it close with good iron/approach play that warped these putting stats, as you can see my green-in-regulation for that round is among my worst (17% GIR), and I remember my putter really was working hard to make that score.
In contrast, my second best ever score saw a much more respectable GIR of 67%, but it took me an extra 10 putts to get down, despite being on the green in fewer shots. Proof that GIRs, although they look nice on the card, they are not the be-all-and-end-all if you can get your putter to work. Furthermore, GIR’s aren’t much good if you’re sticking the green but still facing 90ft putts on every hole.
| Course | Score | PAR | Round Score | GIR | Putts | Putt Average |
|---|---|---|---|---|---|---|
| Widnes Golf Club | 80 | 69 | +11 | 17% | 28 | 1.56 |
| Mersey Valley Golf Club | 84 | 72 | +12 | 67% | 38 | 2.11 |
| Widnes Golf Club | 83 | 69 | +14 | 28% | 36 | 2.00 |
| Mersey Valley Golf Club | 86 | 72 | +14 | 28% | 35 | 1.94 |
| Widnes Golf Club | 84 | 69 | +15 | 22% | 35 | 1.94 |
| Average | 83.4 | NA | +13.2 | 32.4% | 34.4 | 2.01 |
My Bottom 5 Rounds
Looking at the worst 5 rounds of late my GIR falls as low as 19% and I added an extra 2.2 putts per round, topping the scale in one of those rounds with 40 putts, but actually saving my highest score from complete disaster with a respectable 32 putts.
| Course | Score | PAR | Round Score | GIR | Putts | Putt Average |
|---|---|---|---|---|---|---|
| Widnes Golf Club | 93 | 72 | +21 | 11% | 36 | 2.00 |
| Sutton Hall Golf Club | 93 | 72 | +21 | 28% | 39 | 2.17 |
| Widnes Golf Club | 93 | 72 | +21 | 17% | 40 | 2.22 |
| North West National Golf Club | 93 | 72 | +21 | 22% | 36 | 2.00 |
| Widnes Golf Club | 91 | 69 | +22 | 17% | 32 | 1.78 |
| Average | 92.6 | NA | +21.2 | 19% | 36.6 | 2.03 |
I feel there’s 2 anomalies in both of these tables that are warping the figures:
- 38 putts on my 2nd best round is poor (I can’t help but wonder what that score would have been had I been putting well).
- 32 putts on my worst round is pretty good. (If only I hadn’t been mucking around from tee to green)
…however this is just further proof to me that anything can happen in golf, both good and bad – note to self:
Stay focused and never lose patients.
My Worst Putting Round
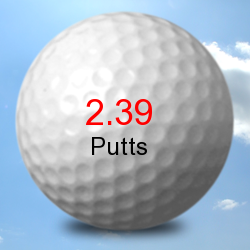
So here’s the crux of my problem – 2.39 putts per hole on my worst round in recent times. This number haunts me and needs to come down if I am to achieve my goal for this year, which is to shoot sub 80.
My tee shots are more and more consistent, plus my iron play, while by no means perfect, is certainly improving due to lessons and consistent practice. But how can I expect my putting average to come down if I don’t clock some hours on the practice greens?
| Course | Score | PAR | Round Score | GIR | Putts | Putt Average |
|---|---|---|---|---|---|---|
| Mersey Valley Golf Club | 90 | 72 | +18 | 61% | 43 | 2.39 |
To Sum Up
 While I would like my GIR percentage to be higher, I’d much rather get my putting average below that 2 putts per hole mark.
From now on I think I’m going to get “2.39” embroidered on all of my golf gloves and printed on all my golf balls. Maybe then when I go the to range I’ll think twice before belting 100 balls instead of honing the parts of my game that need the practice most – PUTTING!
All 26 Rounds
For those that care here’s the complete table of stats from the last 26 complete scorecards, which range from mid summer rounds to sludgy winter golf.
| Course | Score | PAR | Round Score | GIR | Putts | Putt Average |
|---|---|---|---|---|---|---|
| Widnes Golf Club | 80 | 69 | +11 | 17% | 28 | 1.56 |
| Mersey Valley Golf Club | 84 | 72 | +12 | 67% | 38 | 2.11 |
| Widnes Golf Club | 83 | 69 | +14 | 28% | 36 | 2.00 |
| Mersey Valley Golf Club | 86 | 72 | +14 | 28% | 35 | 1.94 |
| Widnes Golf Club | 84 | 69 | +15 | 22% | 35 | 1.94 |
| Widnes Golf Club | 84 | 69 | +15 | 33% | 32 | 1.78 |
| Mersey Valley Golf Club | 88 | 72 | +16 | 44% | 37 | 2.06 |
| Widnes Golf Club | 86 | 69 | +17 | 39% | 39 | 2.17 |
| Widnes Golf Club | 86 | 69 | +17 | 39% | 39 | 2.17 |
| Widnes Golf Club | 86 | 69 | +17 | 39% | 36 | 2.00 |
| Birchwood Golf Club | 89 | 71 | +18 | 28% | 35 | 1.94 |
| Mersey Valley Golf Club | 90 | 72 | +18 | 61% | 43 | 2.39 |
| Widnes Golf Club | 88 | 69 | +19 | 22% | 33 | 1.83 |
| Real Golf Bendinat | 89 | 70 | +19 | 28% | 36 | 2.00 |
| Mersey Valley Golf Club | 91 | 72 | +19 | 50% | 38 | 2.11 |
| Runcorn Golf Club | 89 | 69 | +20 | 28% | 35 | 1.94 |
| Widnes Golf Club | 92 | 72 | +20 | 11% | 37 | 2.06 |
| Widnes Golf Club | 92 | 72 | +20 | 22% | 37 | 2.06 |
| Widnes Golf Club | 92 | 72 | +20 | 11% | 35 | 1.94 |
| Widnes Golf Club | 93 | 72 | +21 | 11% | 36 | 2.00 |
| Sutton Hall Golf Club | 93 | 72 | +21 | 28% | 39 | 2.17 |
| Widnes Golf Club | 93 | 72 | +21 | 17% | 40 | 2.22 |
| North West National Golf Club | 93 | 72 | +21 | 22% | 36 | 2.00 |
| Widnes Golf Club | 91 | 69 | +22 | 17% | 32 | 1.78 |
| Average | 88.42 | NA | +17.79 | 29.67% | 36.13 | 2.01 |
 Just another blog from another rambling keyboard warrior.
Musings on film, music, media and other trivial but essential effects.
Feel free to take a mooch around and comment on how wrong you think I am, but please bear in mind my levels of dyslexia have reach an all new owl.
Just another blog from another rambling keyboard warrior.
Musings on film, music, media and other trivial but essential effects.
Feel free to take a mooch around and comment on how wrong you think I am, but please bear in mind my levels of dyslexia have reach an all new owl.